What Are Anchor Charts?
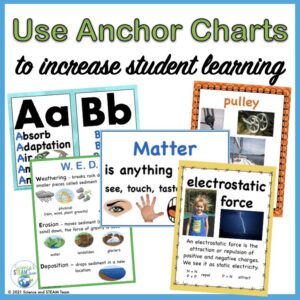
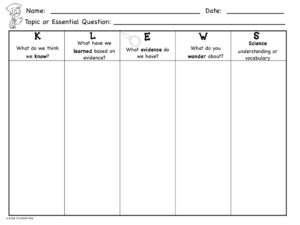
Anchor charts are educational posters. These charts are visuals that help support or “anchor” student learning. Generally, they are made with the students. Sometimes teachers use anchor charts before and while teaching a concept. One of the most common anchor charts is the KWL (what do we know, what do we want to know, and what have we learned). Here is one that we have for science. You can see how it keeps students focused on a topic.
After a topic is discussed, teachers can prompt students to make a chart to summarize information. This engages the students and gives them ownership of the topic. I do this with a range of topics.
Anchor Charts in the STEM Lab
When I first started teaching, I purchased educational posters. I had posters for the scientific method, planets, the human body, energy, and more. First, when teaching in a STEM lab you usually teach many different topics. Secondly, students don’t have input into charts that are purchased. Lastly, most of these posters are 24″ x 36″ and just take up too much room!
Therefore, I started making my own anchor charts. These charts are smaller in size (8″ x 11″), so more of them can be left up at one time. Some things like the scientific method don’t change, so I can use the posters year after year. Most other scientific concepts don’t change often either. After teaching many concepts, I have lots of anchor charts.
What about student input? You lead students to find out what you want them to learn about, right? Below are some examples of how I do that.
How To Use Anchor Charts at the Beginning of the School Year
Class Rules
Throughout my teaching career, I have been exposed to different behavior management systems. The one I liked the best and used the longest was simple.
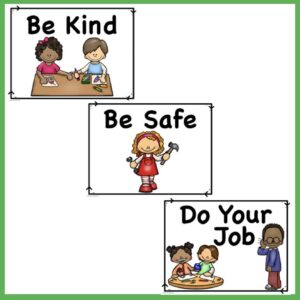
I used these three posters in my special education classroom, my second-grade class, and in my STEM lab. During the first session, I read a book to the class with a kindness or manners theme. Then, we brainstorm ways to show these traits. The teacher can record the ideas on the smartboard, or students can work in small groups and write their ideas on scraps of paper. If I record the ideas, I snap a picture of them when we are finished. Later, I write the important ideas down on sentence strips. I hang the BE KIND poster and put the sentence strips under it. The same process will be used for the other two rules. Safety rules will look different in the STEM lab, but you get the idea.
STEAM
Create a set of posters; one for each letter with the definitions under it. Introduce one letter at a time. As you do so, introduce the concept.
The Scientific Method
Conduct a simple experiment with your class. As you progress through the process, introduce each step, post each step with its definition.
How to Use Anchor Charts as the Year Continues
As the year goes on many science concepts are introduced. As you discuss concepts, make anchor charts as discussed above. You can take what the students have learned and make a poster or set of posters to go with that concept(s). Laminate them, and if it is appropriate, you can use them year after year. There are so many concepts that you can make an anchor chart for.
- the five senses
- matter
- life cycles
- animal classification
- types of energy
- forces and motion
- landforms
- planets
These are just a few of the concepts that are taught in K-4. Set up three areas in your room for anchor charts. This can be a bulletin board, a wall, cabinet doors, etc. Have one area for physical science, one for life science, and one for earth science. When students need to refer to a chart, they will know where to look. Students will often look back when trying to cement concepts.
Comment below to tell us how you use anchor charts.
If you want to save some time, look at our premade anchor charts.
Are you interested in more ways to set up your classroom? Read Valuable Classroom Setup Tips.
And remember, it’s all science!


